Title
Create Simple SQL Server Reporting Services Reports
Introduction – SQL Server Reporting Services
SQL Server Reporting Services (SSRS) is a server-based report generating software system from Microsoft. It is part of suite of Microsoft SQL Server services.
The SSRS service provides a unique interface into Microsoft Visual Studio so that developers as well as SQL administrators can connect to SQL databases and use SSRS tools to format SQL reports in many complex ways. SSRS also provides a ‘Report Builder’ tool for less technical IT workers to format SQL reports of lesser complexity.
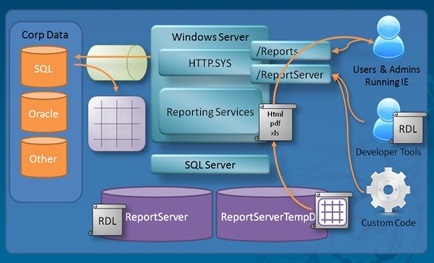
SSRS Architecture

Image is only for reference purpose. Image source: http://bretstateham.com/
You need to install SQL Server 2008 program to install SSRS on your machine. Just run the setup and setup will guide through the installation steps.
Role of Business Intelligence Development Studio (BIDS)
BIDS is included with SQL Server product. When you are running the SQL Server installer, you need to click the Business Intelligence Development Studio checkbox in order to install BIDS. After successfully completing the installation, you are ready to launch BIDS from the Microsoft SQL Server 2008.
Below is the BIDS window.

Now click on add new project (ctrl + shift + N) from top level menu to add Report Server Project to Solution.

Report Creation with the Wizard
Here we’ll go through following steps
- Launch Report Wizard
- Create a shared data source
- Design a query
- Select a report type
- Design a table
- Choose table layout
- Complete the wizard
Launch the Report Wizard
This BIDS solution explorer shows the report project along with the Shared Data Source, Share Data Set and Report component.

Click on the report node and add new report.

Create Data Source
The Data Source contains the information necessary to retrieve the data we pull in our report. Report Services can access data in the relational databases, OLAP databases, cialis generique and any other data source for which like an ODBC or OLEDB drives etc.

When we select shared data source it means that this data source can be used by any report in the same project, and if data source isn’t shared it means the scope of data source is for a specific report and can’t be shared with any other report.
In this project I don’t have any shared data source so I’ll be defining my own data source by specifying below parameters.
- Name – Specify the name of the data source.
- Type – Select from the available option
- Connection string – To specify the connection, rather than manually entering the connection string click on edit button and select the required parameters, as I did for my project.
- Credentials Button – Check this button to specify the credentials used by your data source.
- Make this shared data source checkbox – Select this box if you want to make this as a shared data source so that it can be used by other reports in the same project.


Click next to design the query
Query Builder
The design query step of the report wizard allows to specify what data we want to retrieve from our data.

Here you have two option, either use the Query Builder button to graphically build you query, or directly enter query to the text area.
select * from dbo.Test

Design Table
This windows allow us to layout the available filed on our report choosing between Page, Group and Details.

- Page – Put a field in this list when you want to begin a new page when the value of the field changes
- Group – Group by the fields in this list
- Details – The fields in this list appear in each row of the report
As I’m using the simple select query so I won’t be doing any changes here.
Choose the table layout
Using this window you can specify the layout of your table

Click next and specify the Report name.

And then click finish and your report is ready,

Open report and click on Preview button you’ll be able to see the output of your report.

